
Designing Analytics for Creative Tools: Finding Clarity in Complex User Journeys - Canva Tracking Plan
Creating analytics for creative tools like Canva seems like a paradox at first. How do you measure success in a process that's inherently iterative, personal, and often non-linear? When every color change, text adjustment, or element placement could be tracked, how do you avoid drowning in data while still capturing what truly matters? As someone who has implemented analytics for various products, I faced this exact challenge when approaching Canva's tracking plan.
The solution wasn't in tracking more - it was in zooming out to find clarity. This post will show you how to build analytics that capture meaningful insights for creative tools, using Canva as our example. We'll explore how to identify true success moments, align tracking with strategic goals, and structure your analytics in a way that brings order to creative chaos.
In this content series - season 1, I create a tracking plan for a typical start-up tool every day for four weeks (I take a break on the weekend), so 20 in total. This is the 6th one: Canva. Here is the season overview:
How to Find Success Moments in Creative Processes: Moving Beyond Click Tracking to Meaningful Outcomes
Why Traditional Click Tracking Fails Creative Tools
When I first approached creating a tracking plan for Canva, I had the same hesitation many analysts face: How do you measure success in a tool where every creative decision could be tracked? The temptation to track every color change, text edit, and element placement is strong - but it's a path that leads to analytical chaos.
Think about a typical design process in Canva. A user might:
- Add and remove multiple text elements
- Try different colors and fonts
- Move elements around dozens of times
- Switch between multiple templates
- Make countless minor adjustments
The problem isn't just the volume of data. It's that granular tracking of creative actions tells us very little about whether users are actually successful with the tool. A user who makes fifty adjustments to their design isn't necessarily more successful than one who makes five - they might just be struggling to achieve their desired outcome.
This is where traditional click tracking fundamentally misses the mark for creative tools. When I work with clients implementing analytics, I often have to push back against the desire to track everything. You don't need to know every time someone clicks the color picker or adjusts an element's position. These interactions create noise that obscures the signal we're really looking for.
Instead, we need to ask: What actually indicates that a user has successfully achieved their goal? In creative tools, success isn't about the number of actions taken - it's about reaching a point where the user feels their creation is worth sharing or using. This is why we need to zoom out from click-level tracking and find more meaningful indicators of success.
The Art of Zooming Out: Identifying True Success Indicators
When creating analytics for creative tools, success moments aren't always obvious. You have to zoom out from the creative process itself and look for clear signals that indicate users have achieved something valuable.
In Canva's case, there are three unmistakable moments that signal success:
- When a user exports their design
- When they share it with others
- When they send it to print
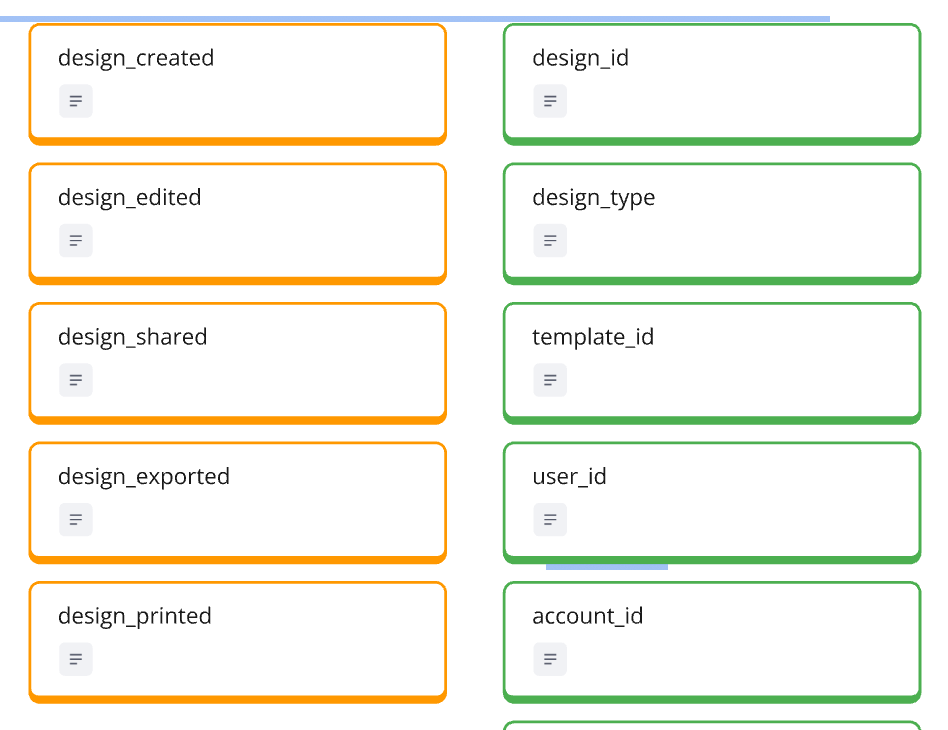
"In Canvas' case, it's when I download something, when I share something, or when I give something out for printing. This means I'm happy with the result," as I explained in the video. These actions tell us something crucial: the user believes their creation is good enough to use or share.
This pattern of "zooming out" works across different creative tools. Take Miro, for example - while users might spend hours moving sticky notes and drawing connections on their whiteboard, the real success moment comes when they share their board with teammates. The sharing action signals that the creative process has reached a meaningful milestone.
Finding these indicators requires asking two key questions:
- At what point do users demonstrate confidence in their creation?
- When does the creative process translate into actual value?
The beauty of this approach is that it cuts through the complexity of creative processes. Instead of trying to measure whether someone is using the tool "correctly," we're measuring when they're using it successfully. This distinction is crucial for creative tools where there's no single "right way" to achieve an outcome.
Remember: Success indicators should be clear and unambiguous. If you find yourself debating whether something counts as success, you probably need to zoom out further. The goal is to find those moments where user intent is crystal clear - where their actions tell you, without any doubt, that they've achieved something valuable.
Turning Success Moments into Actionable Metrics
Subscribe to continue reading