Metric Trees for Digital Analysts

Content in digital analytics tends to be pretty predictable. Juliana pointed this out a while ago - most content in our field focuses on implementation, rarely touching on actual data analysis or how to work with data meaningfully. I see similar patterns.
If you look at what people publish or check out talks at typical conferences, it's heavily weighted toward implementation topics and technical hacks. These days, you'll see tons of content about working with GA4 data in BigQuery - it's the hot new thing, but again, just another implementation topic. On the other end of the spectrum, you get these philosophical, high-level wisdom "let me tell you how the world works" kind of talks of industry veterans.
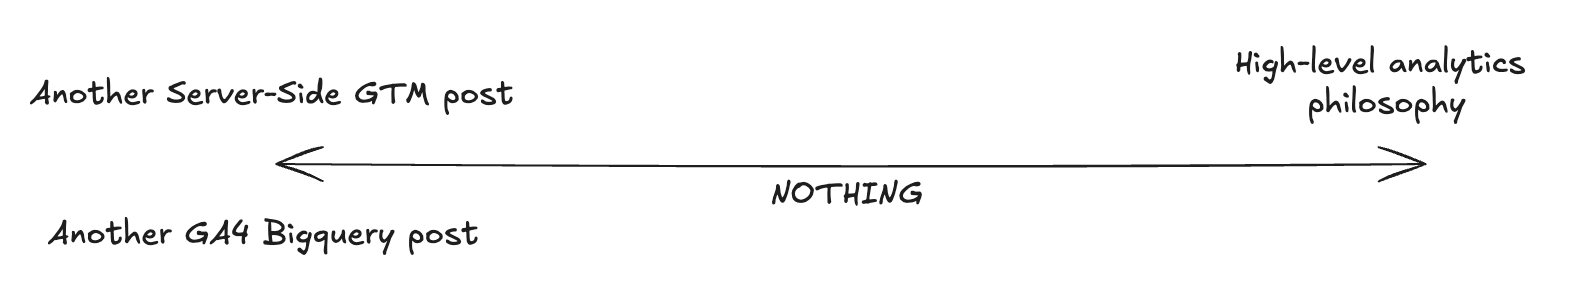
But there's this huge gap in the middle: how do we actually apply analytics in practice? I understand why this gap exists. It's challenging to write about real analytics work for two main reasons.
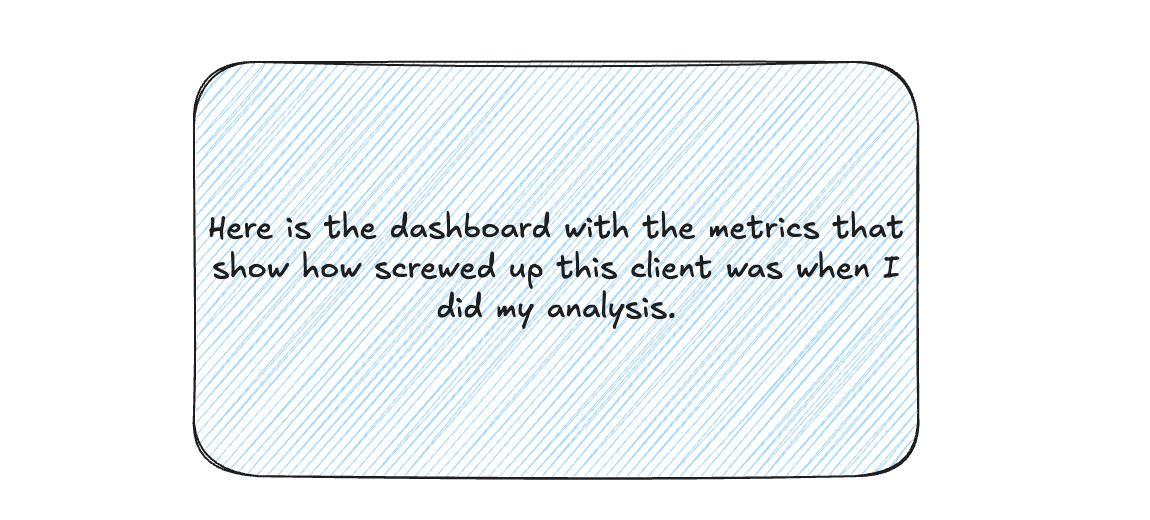
First, when you're doing actual analytical work for your company or clients, you usually can't just share it openly. Sure, you can do those high-level celebration case studies (though we all know real projects never work out that neatly). But you can't really dig in and say "here's the specific problem my client faced, here's how we dug through different datasets, here's what we found" - you don't want to put your company or client in an awkward position.
The second reason, I think, is that it's just genuinely difficult. Implementation is essentially an engineering problem - predictable and solvable with enough debugging time. Once you figure it out, you can share the solution and others can apply it. But applying data to business outcomes is significantly harder, unless you're approaching it from that high-level philosophical view where people can interpret it like a horoscope and take what they want from it.
I don't have an easy answer for this problem. However, I've found something interesting in the broader data space - where data engineers and analytics engineers hang out - that might help bridge this gap. Something that could help us bring a better business perspective to our work.
We need to talk about metrics.
Why metric matters. Really matters
I have a complicated history with metrics. They've always made sense to me - kind of like how breathing air makes sense, but not something I spent much time thinking about. I used to try to ignore them, or at least avoid them. When clients would ask "what metrics should we track?", I'd give them the standard list of e-commerce metrics. But I was never really comfortable with that approach.
I was good at critiquing specific metrics. If someone said "we want to optimize our bounce rate", I could easily explain why that wouldn't really help them - bounce rate is a tricky metric. What I was missing, though I didn't realize it at the time, was a system for thinking about metrics.
A metric by itself is pretty meaningless, even when you wrap them in a container and call them KPIs (key performance indicators). Having a single KPI didn't really make sense to me. I wasn't particularly inspired by the concept of North Star metrics either, for two main reasons. First, people interpret North Star metrics very differently, and most interpretations, in my opinion, don't make much sense. When someone suggests a revenue-related North Star metric, I struggle with it. Sure, if you're running a for-profit business, some of your lagging or output metrics will involve revenue. But saying "profit margins are our North Star metric" is like stating the obvious - we need air to breathe.

There are better resources about North Star metrics out there. John Cutler created an excellent ebook with Amplitude explaining North Star metrics in a way that makes sense to me. But it was still a single-purpose framework - useful, but not enough to warm me up to metrics in general.

So why do metrics actually matter? In analytics, we often struggle to translate the output of an analytical system into meaningful business impact. A conversion rate in a funnel comes close - we can say "if we improve this conversion rate by 10%, we potentially make 10% more revenue." But beyond that, it gets tricky. This is where metrics can build a powerful bridge between analytical insights and actionable business outcomes.
Why does this work? I'm going to try to explain in this post. I'll also introduce a concept that helped me establish a much better relationship with metrics:
the metric tree.
How can we find love for metrics again?
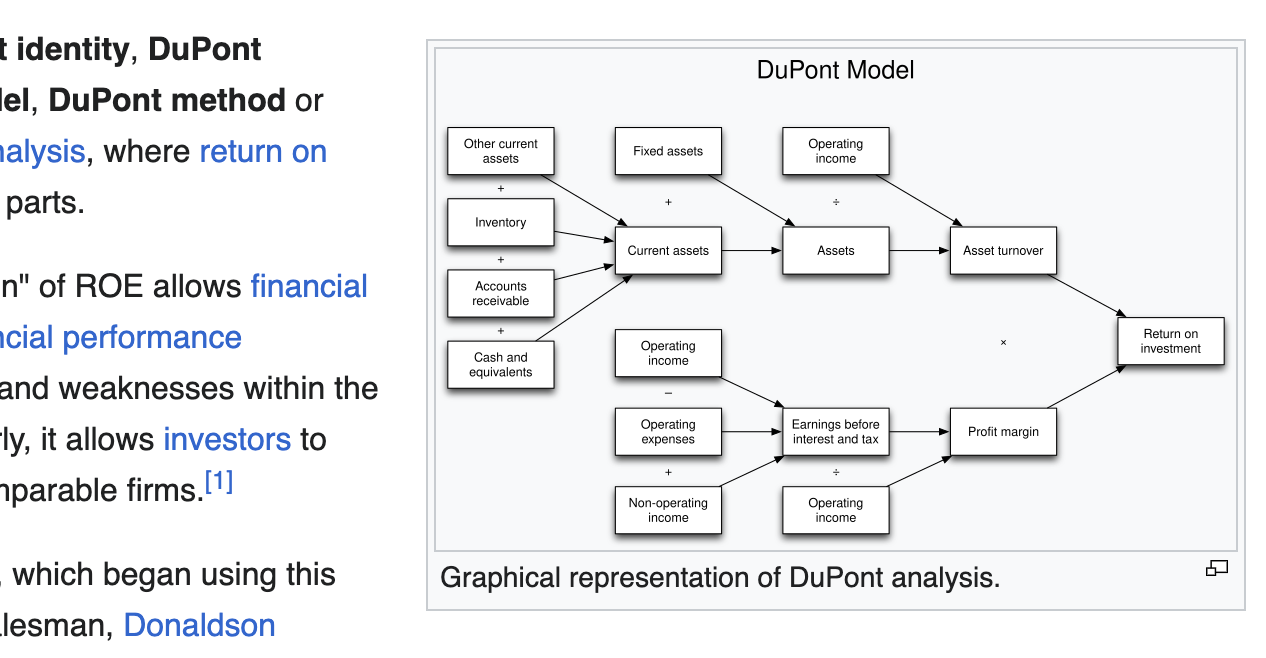
I started to rediscover my appreciation for metrics when I came across Abhi's work with metric trees. This wasn't actually a new concept - I'd learned about it in university under a different name: the DuPont schema. I loved it back then, which makes it interesting to reflect on why I forgot about it (honestly, no idea - I guess, you simply forget things).
When I started working deeply in analytics and data, I lost sight of these tools because I was so focused on the technical engineering side. But seeing Abhi's work and talking with him brought metrics back into focus. I became curious to test this approach in my current work - could it solve the problems I'd had with metrics? Turns out, it did.
Why did it work where other approaches had failed? I think it's because metric trees add an essential ingredient that, when missing, makes metrics pretty useless: relationships between metrics. As I mentioned earlier, a metric standing alone often struggles to articulate its place and meaning. Metrics become powerful when they relate to each other.
This is what I loved about the DuPont schema in business school - you could see how essential company metrics related to each other. One branch explained how costs worked, another showed how revenue developed. This helped you understand both how to improve revenue and how to increase cost efficiency. These relationships were what was missing in most metric setups I'd worked with in analytics.
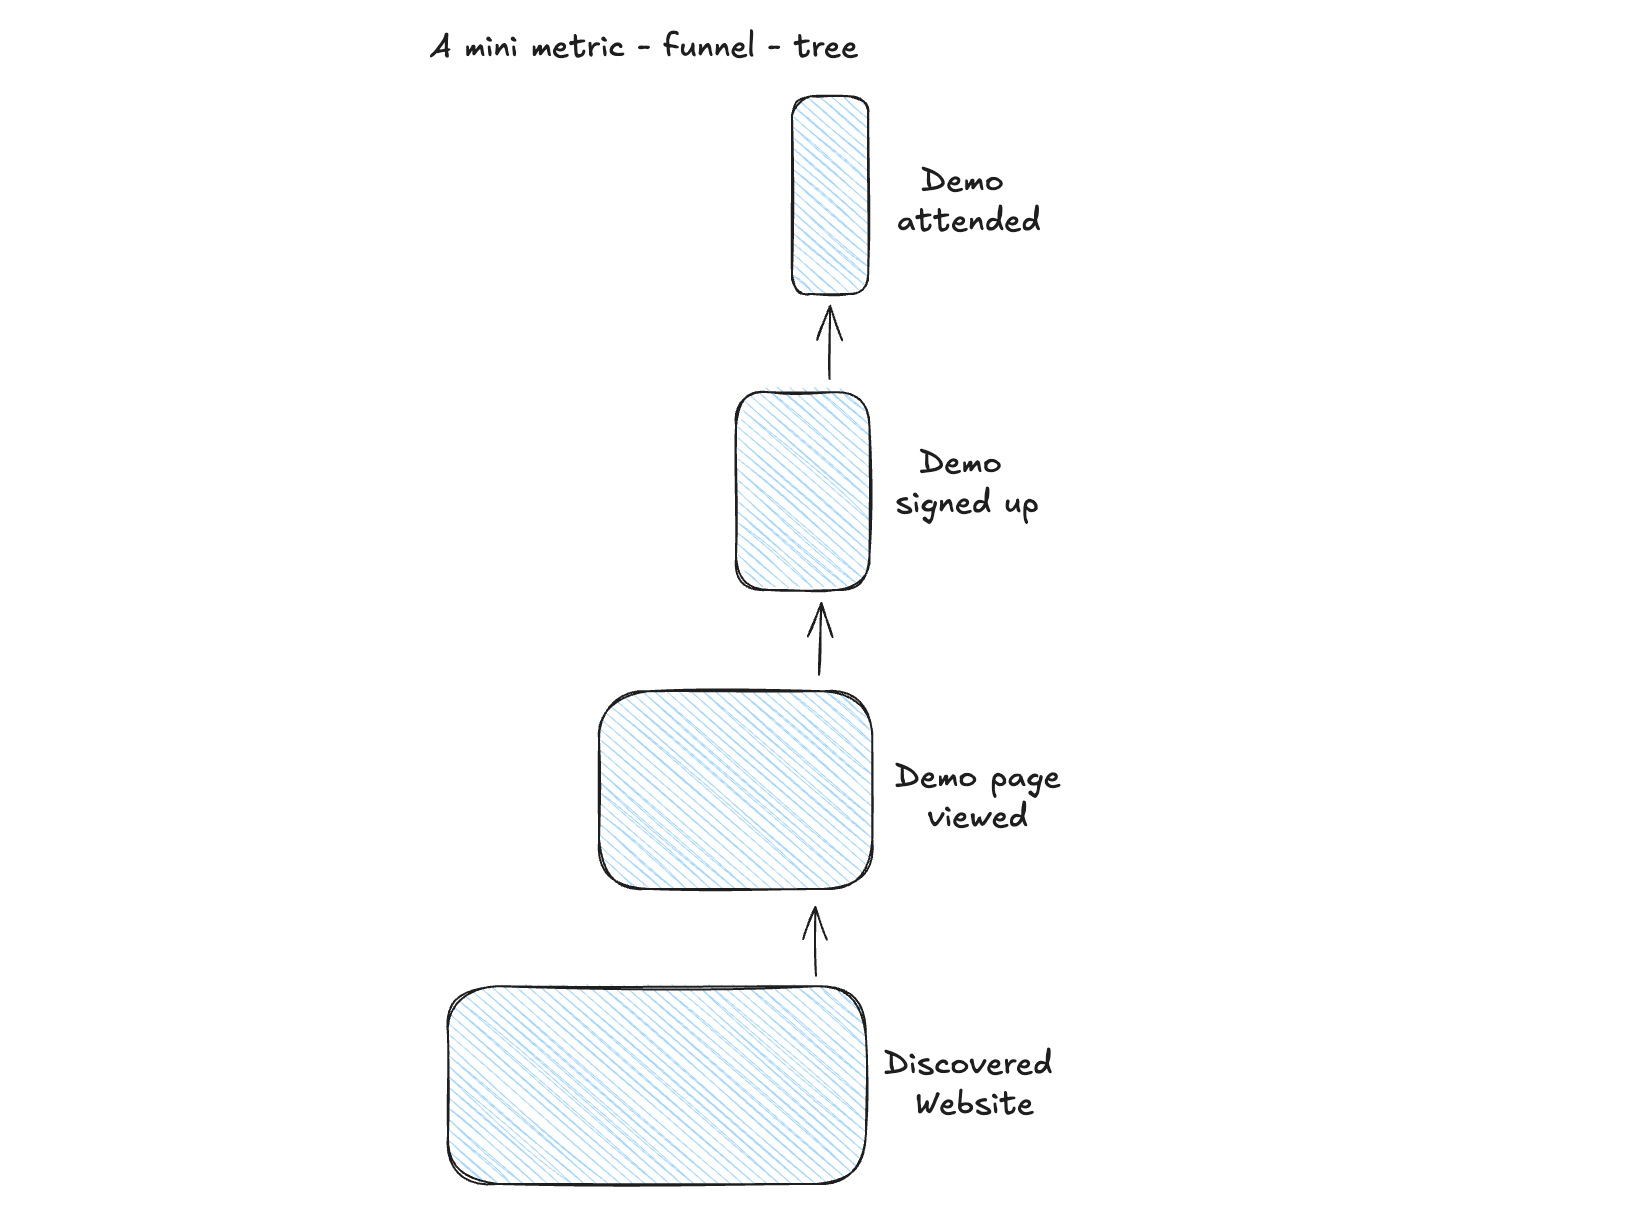
The closest thing to a metric tree I'd used in digital analytics was the classic funnel. A funnel is essentially a snapshot of a metric tree - a specific view that I'll showcase later. What makes a funnel powerful is the relationship between its metrics. You have an input volume (people starting the funnel) and percentages showing how many people you lose at each step. These metrics are interconnected - if you do better at moving people from step one to step two, you have more opportunities to move people from step two to step three. When you improve the first conversion rate, you might see an impact on the funnel's final output, often tied to revenue.
This system finally made sense to me. Rediscovering these relationships between metrics was the essential ingredient I needed to find my love for metrics again. So if you're reading this and you've lost some love for metrics too, maybe I can help you rediscover it. Let's continue.
The power of metric trees
What changes when you work with a metric tree? It doesn't make all your problems disappear - you might even discover new ones. But after running metric tree workshops for over a year and incorporating them into product analytics setups, I've noticed some significant benefits.
Metric trees immediately solve one crucial problem: they make data setups accessible to all business teams. Metrics become a universal language, especially when expressed in a tree format. Everyone can see how your business or product is structured - what building blocks you're using to show how your business actually works. This resonates with all different business teams.
I've run metric tree workshops with groups of 15+ people from various departments. Everyone grasped the concept and could contribute meaningful feedback. For the first time in my experience discussing data topics with different business teams, we had genuinely constructive discussions. I watched sales, marketing, and product teams align on specific business aspects. The metrics made it transparent, showing how it all fits together. Everyone could contribute thoughtfully about metric definitions and which metrics made sense.
It's both a powerful communication tool and mapping tool. For data and analytics teams, it's a way to create a map of how they think the business works. You can show this to different business teams and get their input on needed adjustments. When you get requests for insights, you can pull out the metric tree as a map and ask, "Where does this fit? What part of the tree will this analysis impact?" This immediately provides context for the analysis.
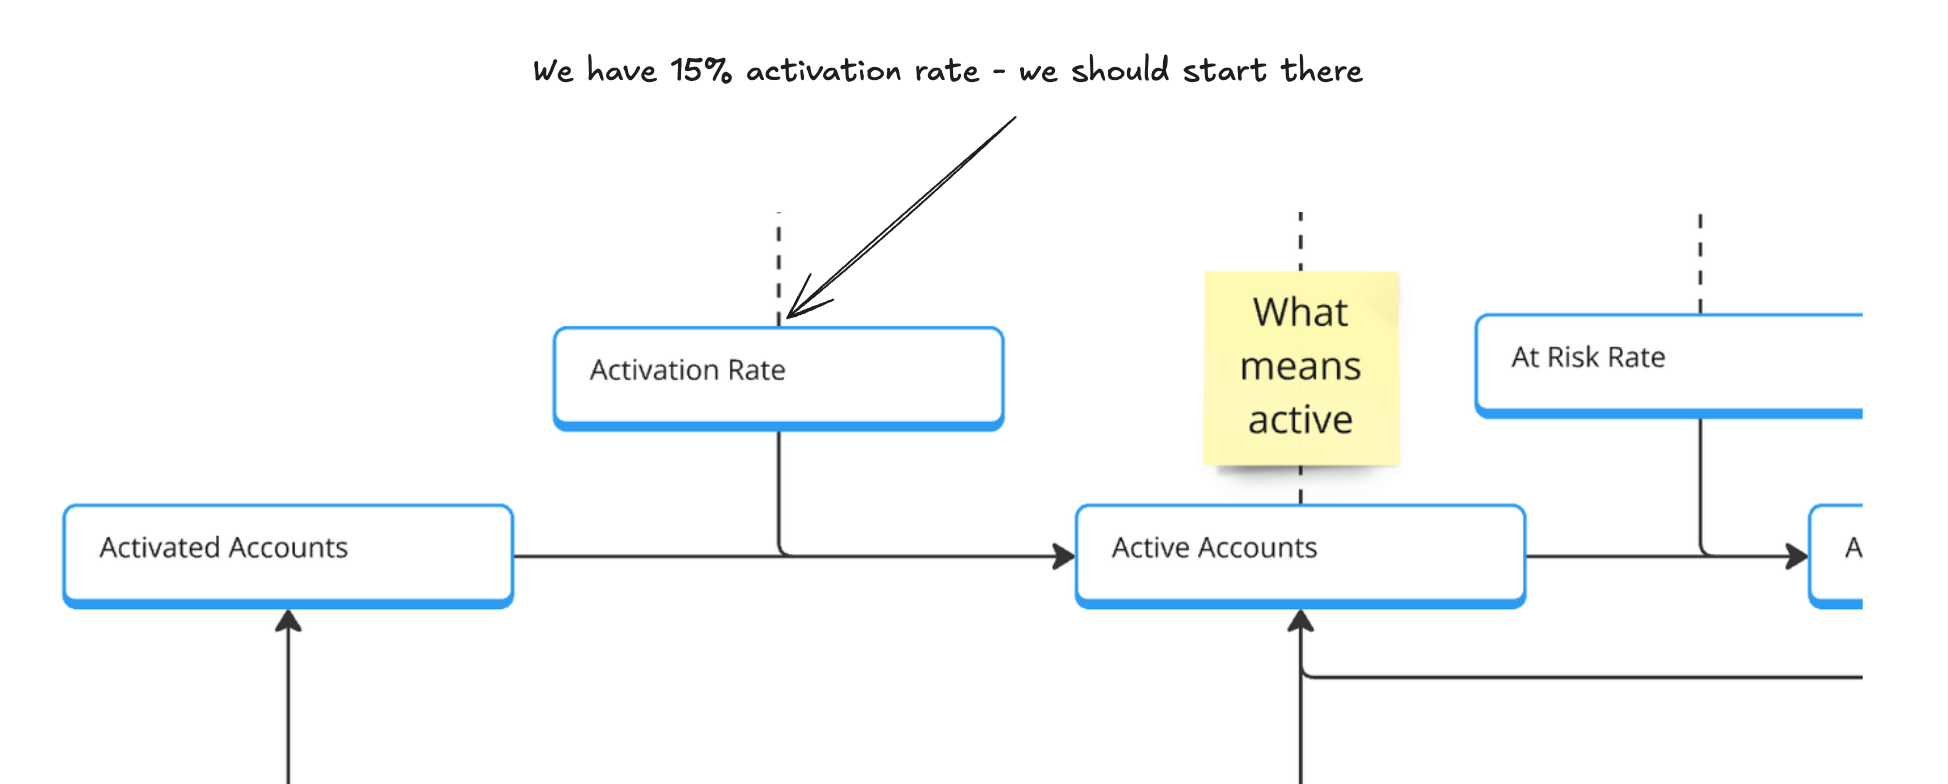
For example, if we want to analyze the conversion rate between two steps, we can instantly see how it influences downstream metrics and how far it is from direct revenue impact. This helps us suggest better analysis candidates, saying things like, "That looks interesting, but what if we looked at this area instead? We're seeing a much bigger drop-off here."
The metric tree is remarkably effective as a communication tool, even without numbers attached. I've seen its impact in workshops before we'd calculated anything. Of course, it becomes even more powerful when you can visualize the complete tree with actual numbers.
There are various ways to implement this. You can create it manually in any whiteboard tool, or use specialized tools like DoubleLoop or Count for metric tree visualization. Lightdash now supports this too. More tools are moving toward providing blank canvas capabilities where you can easily build out metric tree visualizations.
While the metric tree serves as an optimization tool and works great for root cause analyses, its primary value for me is as a communication bridge between analytics and business teams, ensuring we're all talking about the same things.
What is a metric tree
A metric tree is technically an upside-down tree. It typically has one output metric at the top - usually your main business metric, either profit-related or revenue-related if you're focusing just on the revenue side. From there, it branches downward. The tree can branch out extensively or remain quite lean.
If you're just getting started with metric trees, I recommend keeping them simple. It's easy to make them more complex later, but the real magic happens when you can bring a complex tree back to a simpler version.
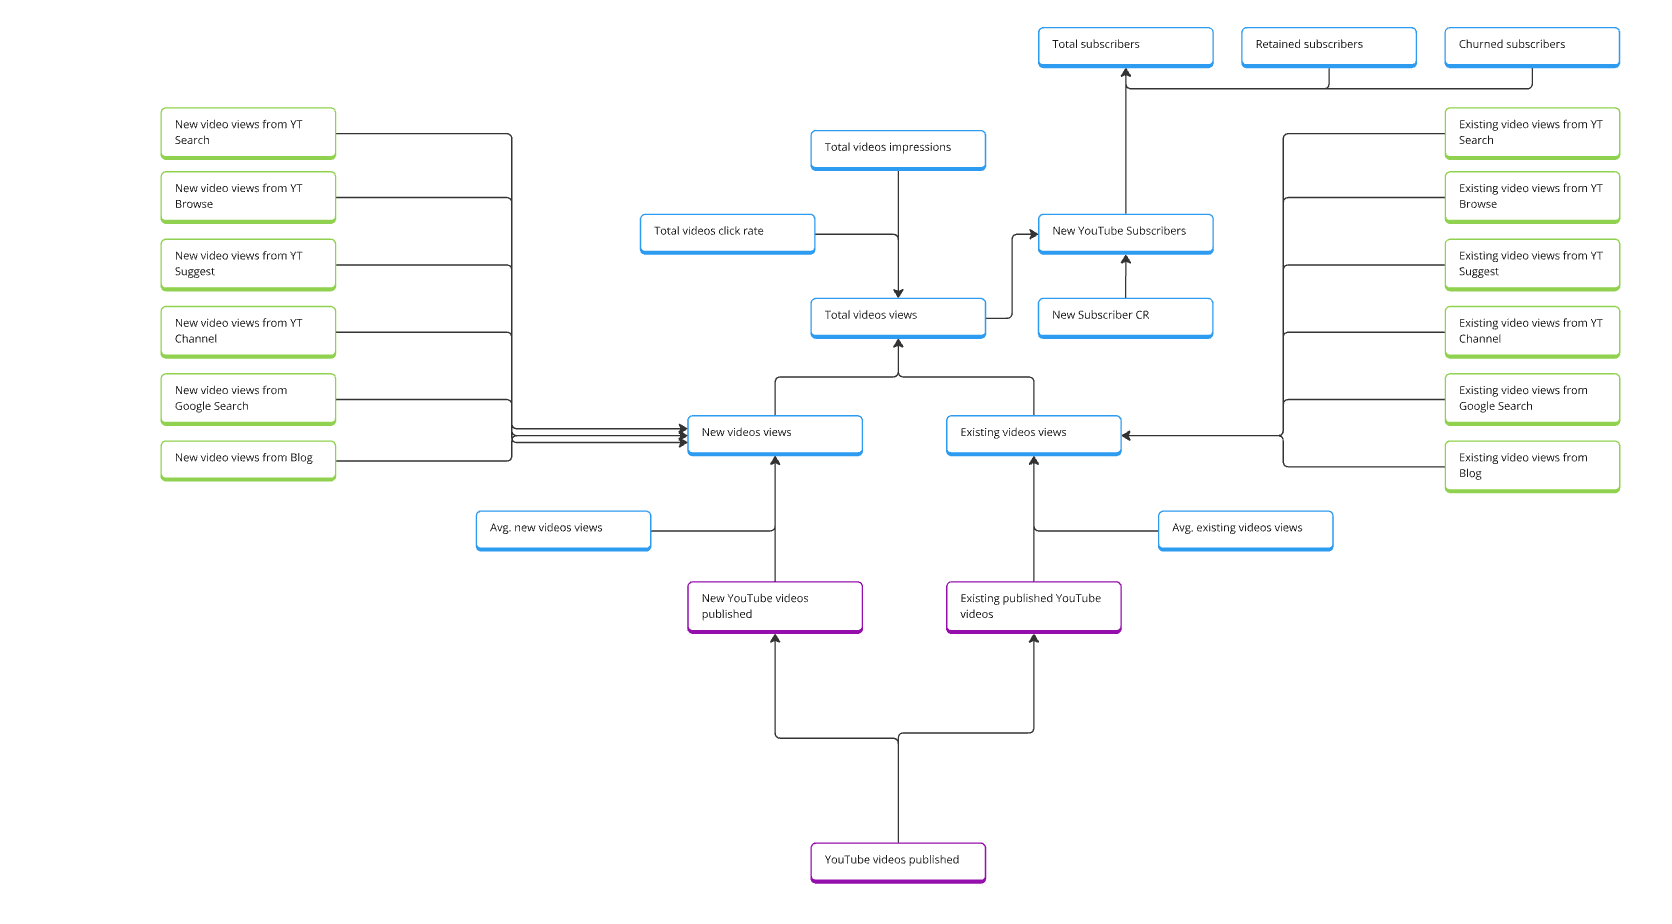
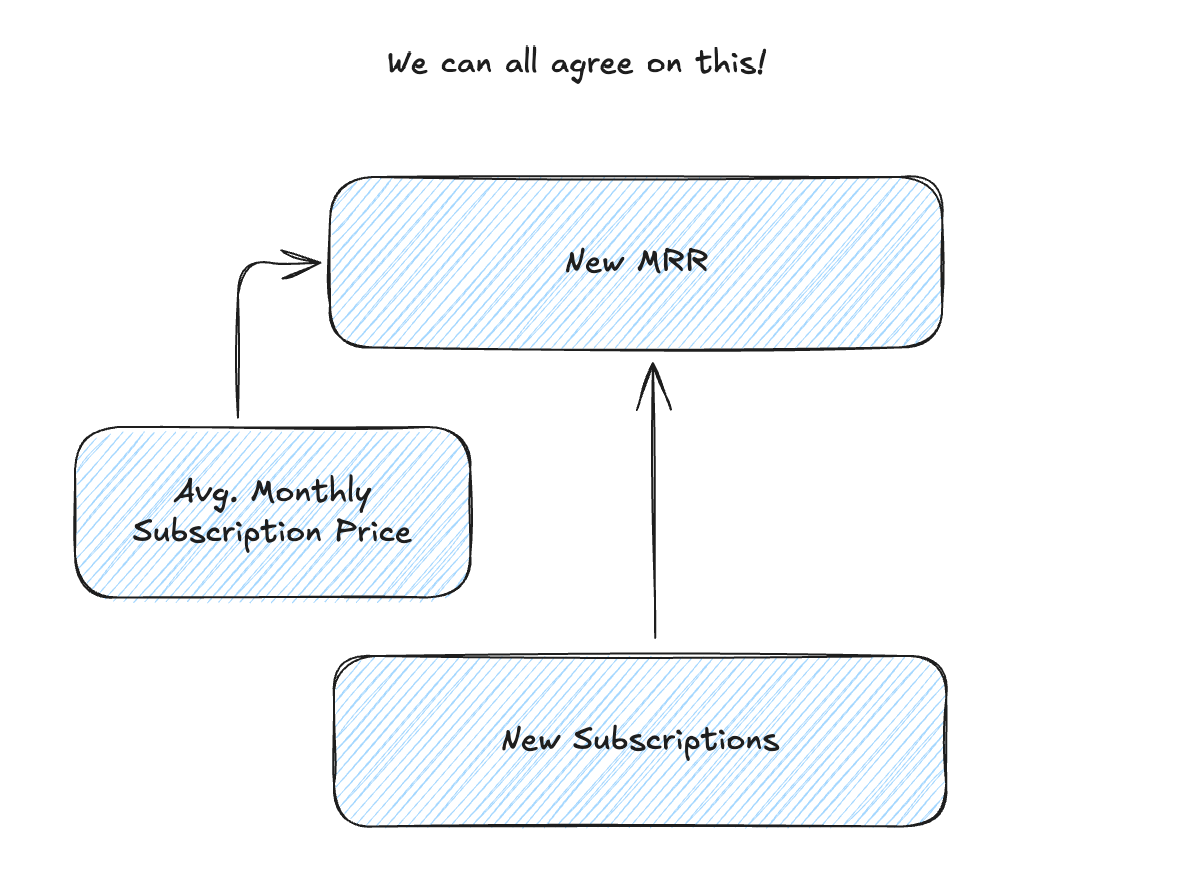
There are two types of metric trees. The first is what I call a deterministic metric tree, which is what I usually use. In this version, you can represent the entire tree in one equation - all the metrics add up, making the whole tree one calculation.
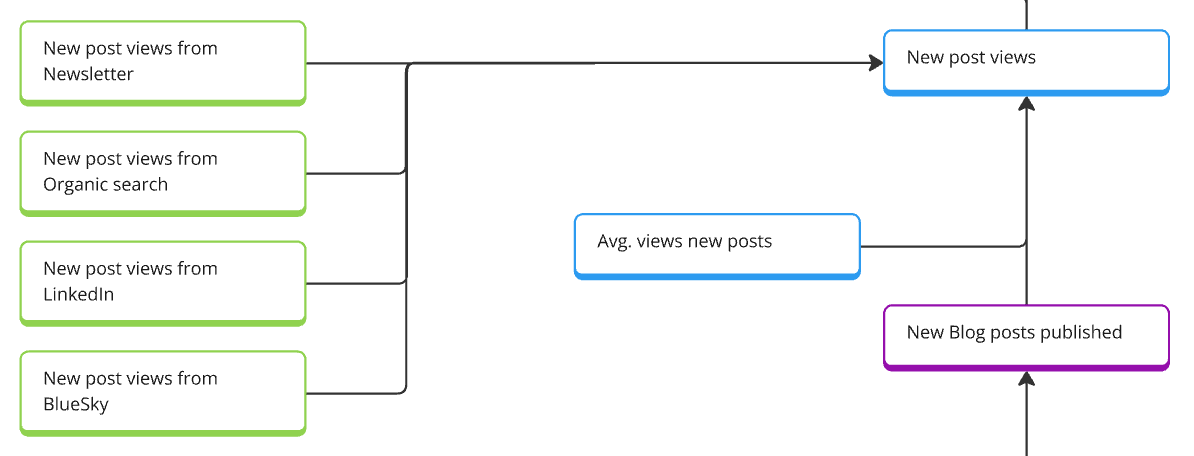
Total video clicks = Total videos click rate * ((New YouTube Videos * Avg. new video views) + (Existing YouTube videos * Avg. existing video views))
The second type shows relationships that indicate how metrics influence each other but without precise formulas explaining these influences (more a probabilistic model). This version makes sense in certain scenarios. For example, when examining how product behavior impacts subscriptions, it's hard to create an exact equation. You might know that using a specific feature affects whether someone starts a subscription, but quantifying that impact is difficult.
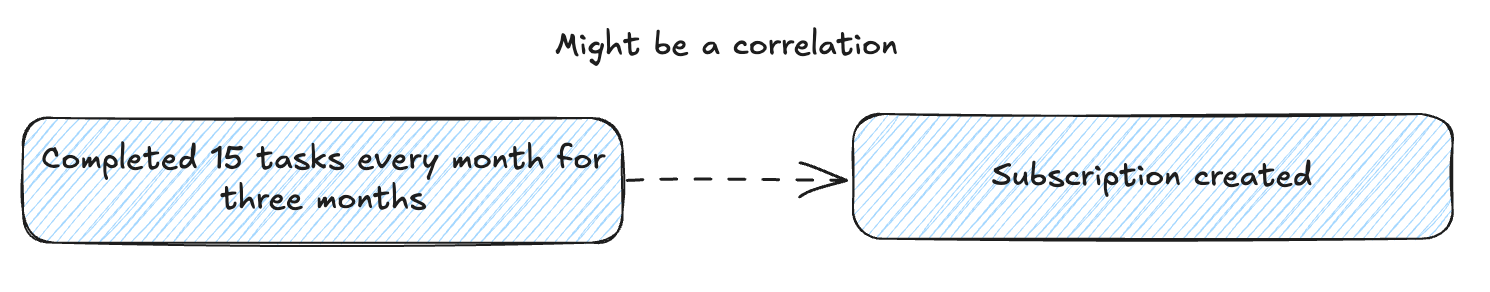
While there are models to get numeric insights, they all have limitations. That's why I recommend starting with deterministic trees - they're easier to test and build since you can verify if the equations make sense. However, remember you can always express relationships in a metric tree without equations. You can simply indicate that one metric might influence another, even if you don't yet know the exact relationship.
Let me share two design aspects I often use in metric trees. First, they can have different levels of detail. You might start with a high-level tree representing your business, then zoom in on specific areas like customer acquisition with more detail. You can stack metric trees on top of each other, but remember - more stacking means more complexity.
In my design process, I often create an extensive model first. But the next step is usually simplifying it because you have to work with it practically. A tree with 300 metrics means you need systems to calculate, visualize, and act on all 300 metrics. While possible, this requires a sophisticated organizational setup. That's why I recommend simplifying when possible.
Metric trees can also include dimensions, which work like filters. While I wouldn't recommend this for beginners, it's possible to include dimensions like campaign sources to filter your tree based on where users come from. This is straightforward in design but can be challenging in practice - some metrics might have certain dimensions while others don't, leading to attribution problems that are often difficult to solve. Until you can represent your tree with actual numbers, I'd suggest leaving out these design options. But it's good to know they're possible.
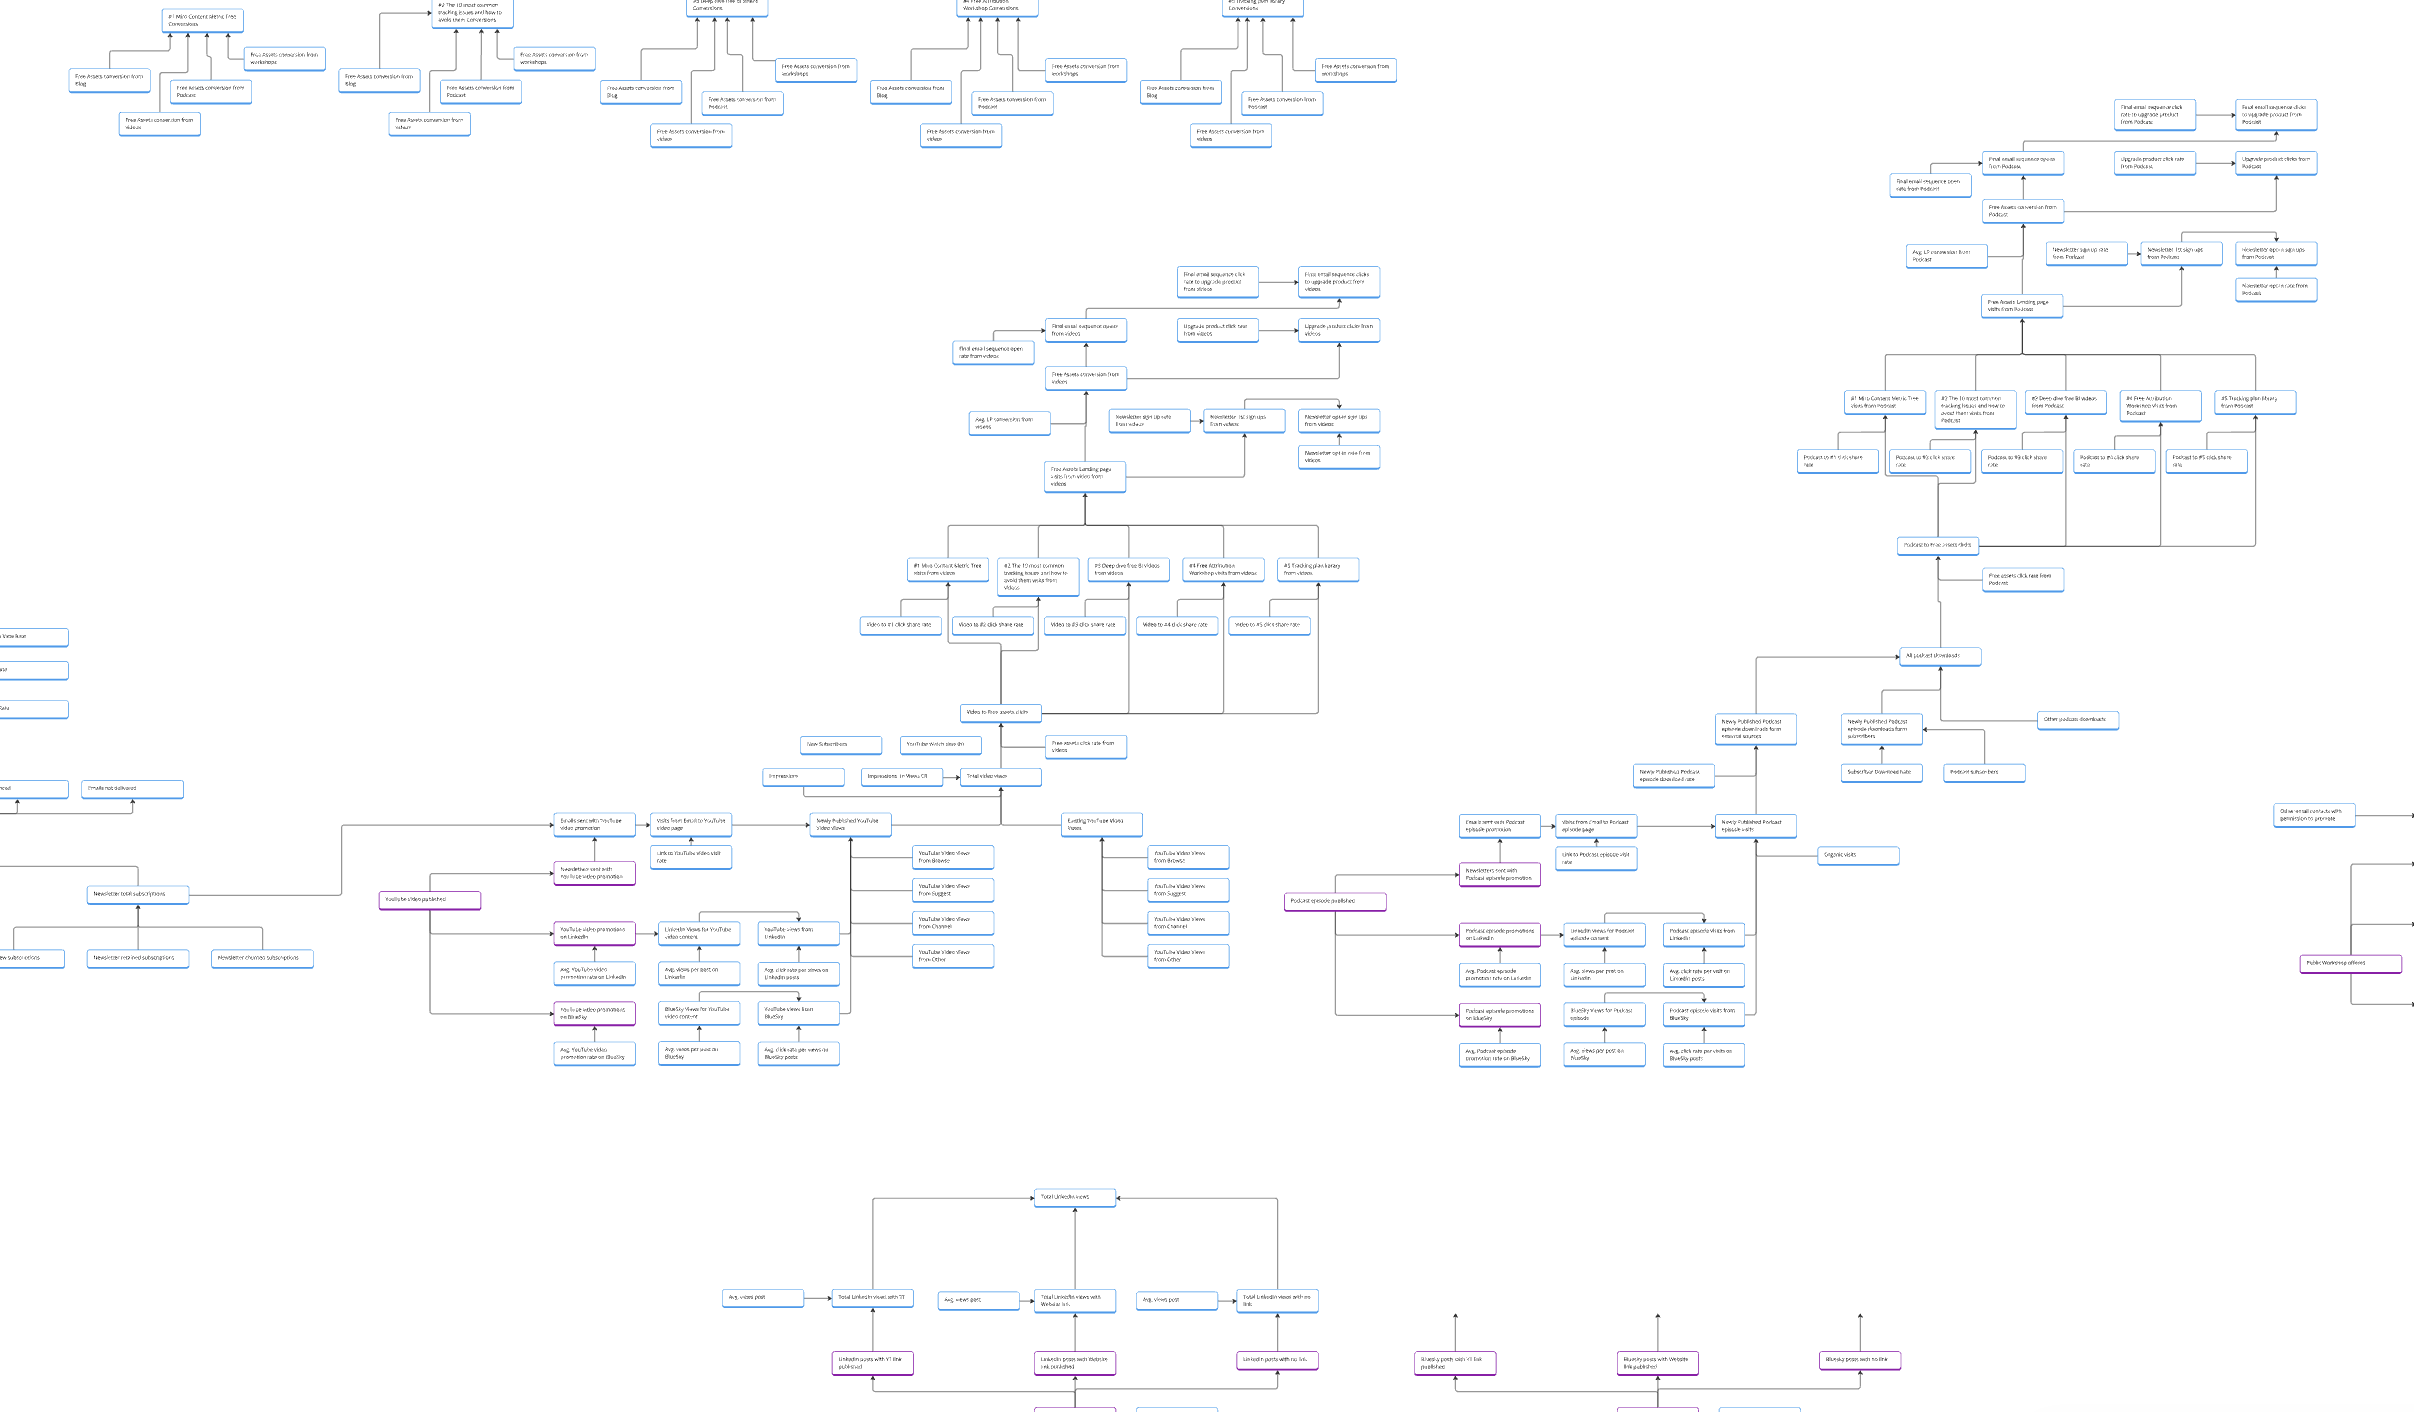
This gives us a good foundation to look at some examples. I've chosen three use cases you might encounter as a digital analyst, to show how you can apply this in your own projects.
Examples
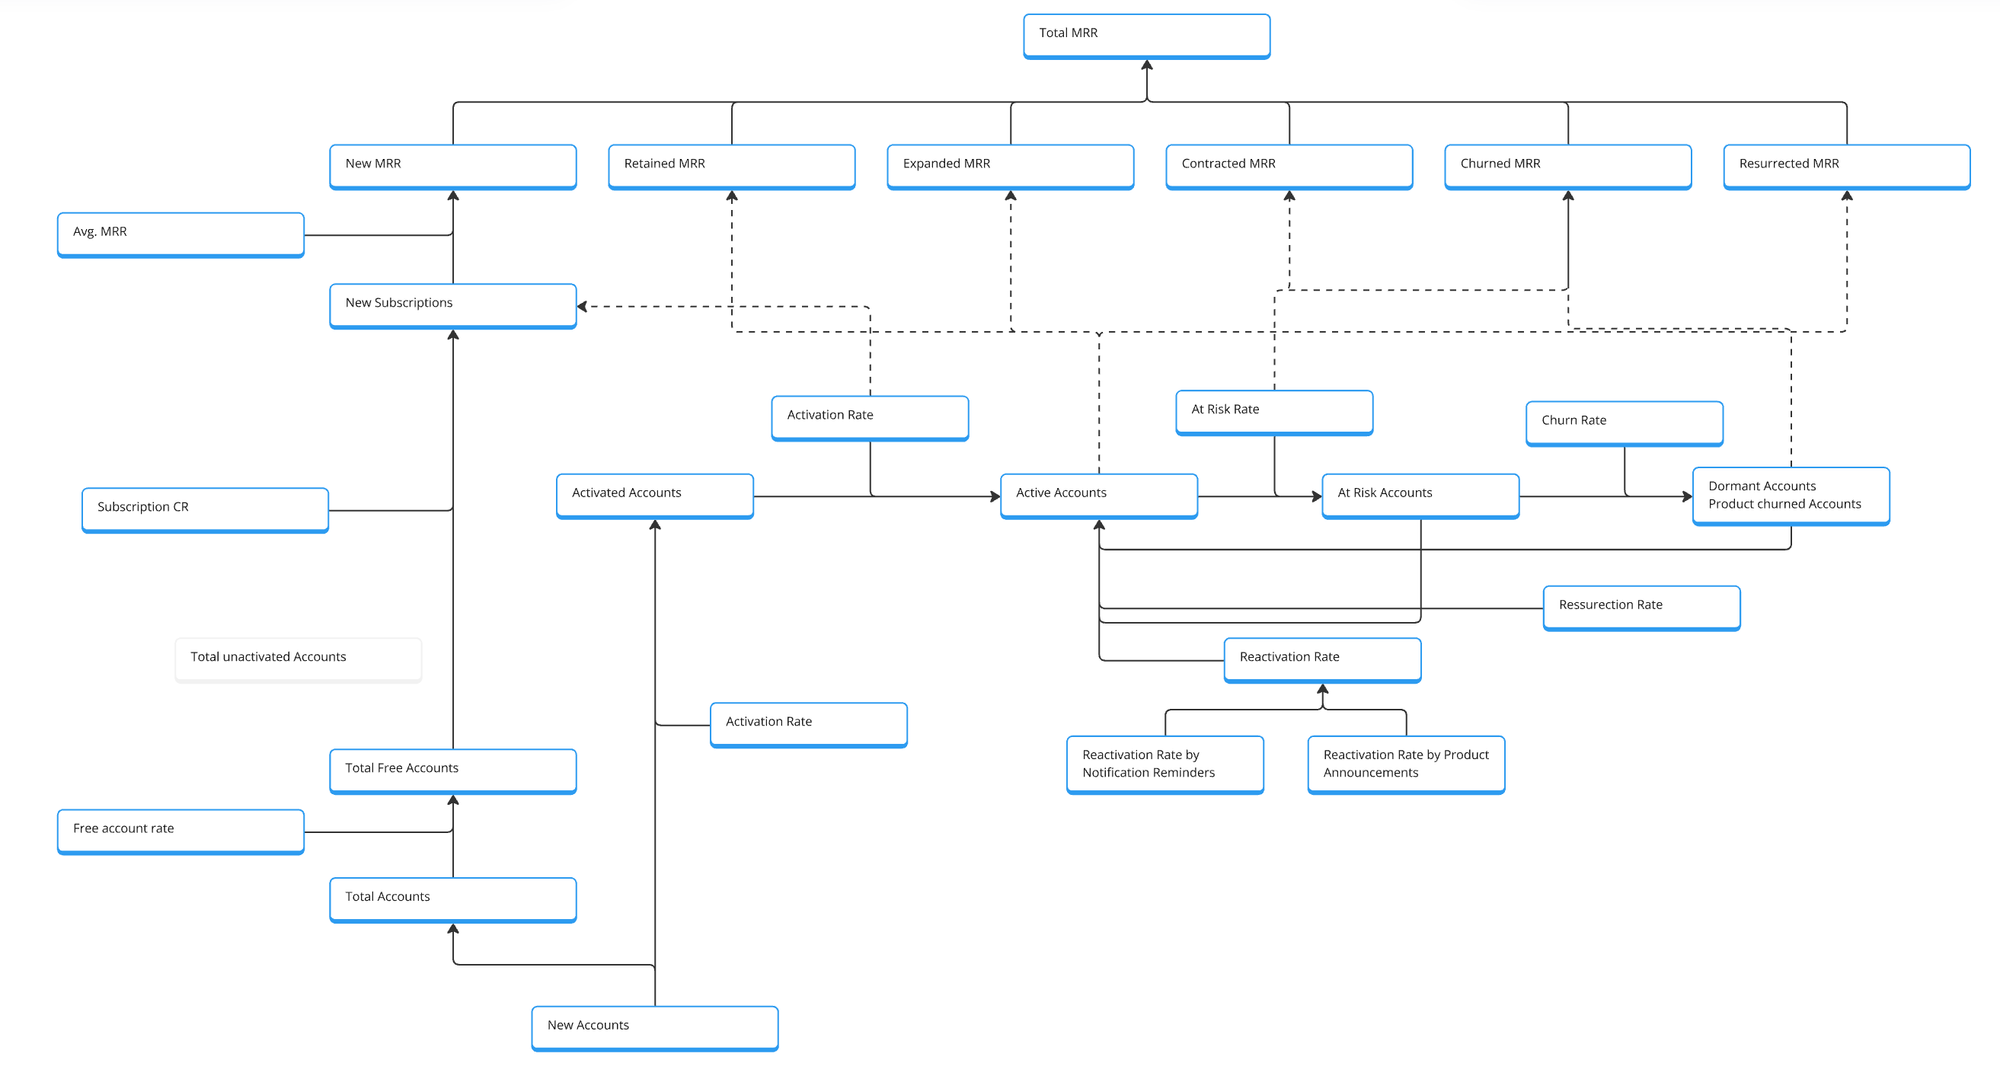
B2B Software as a service
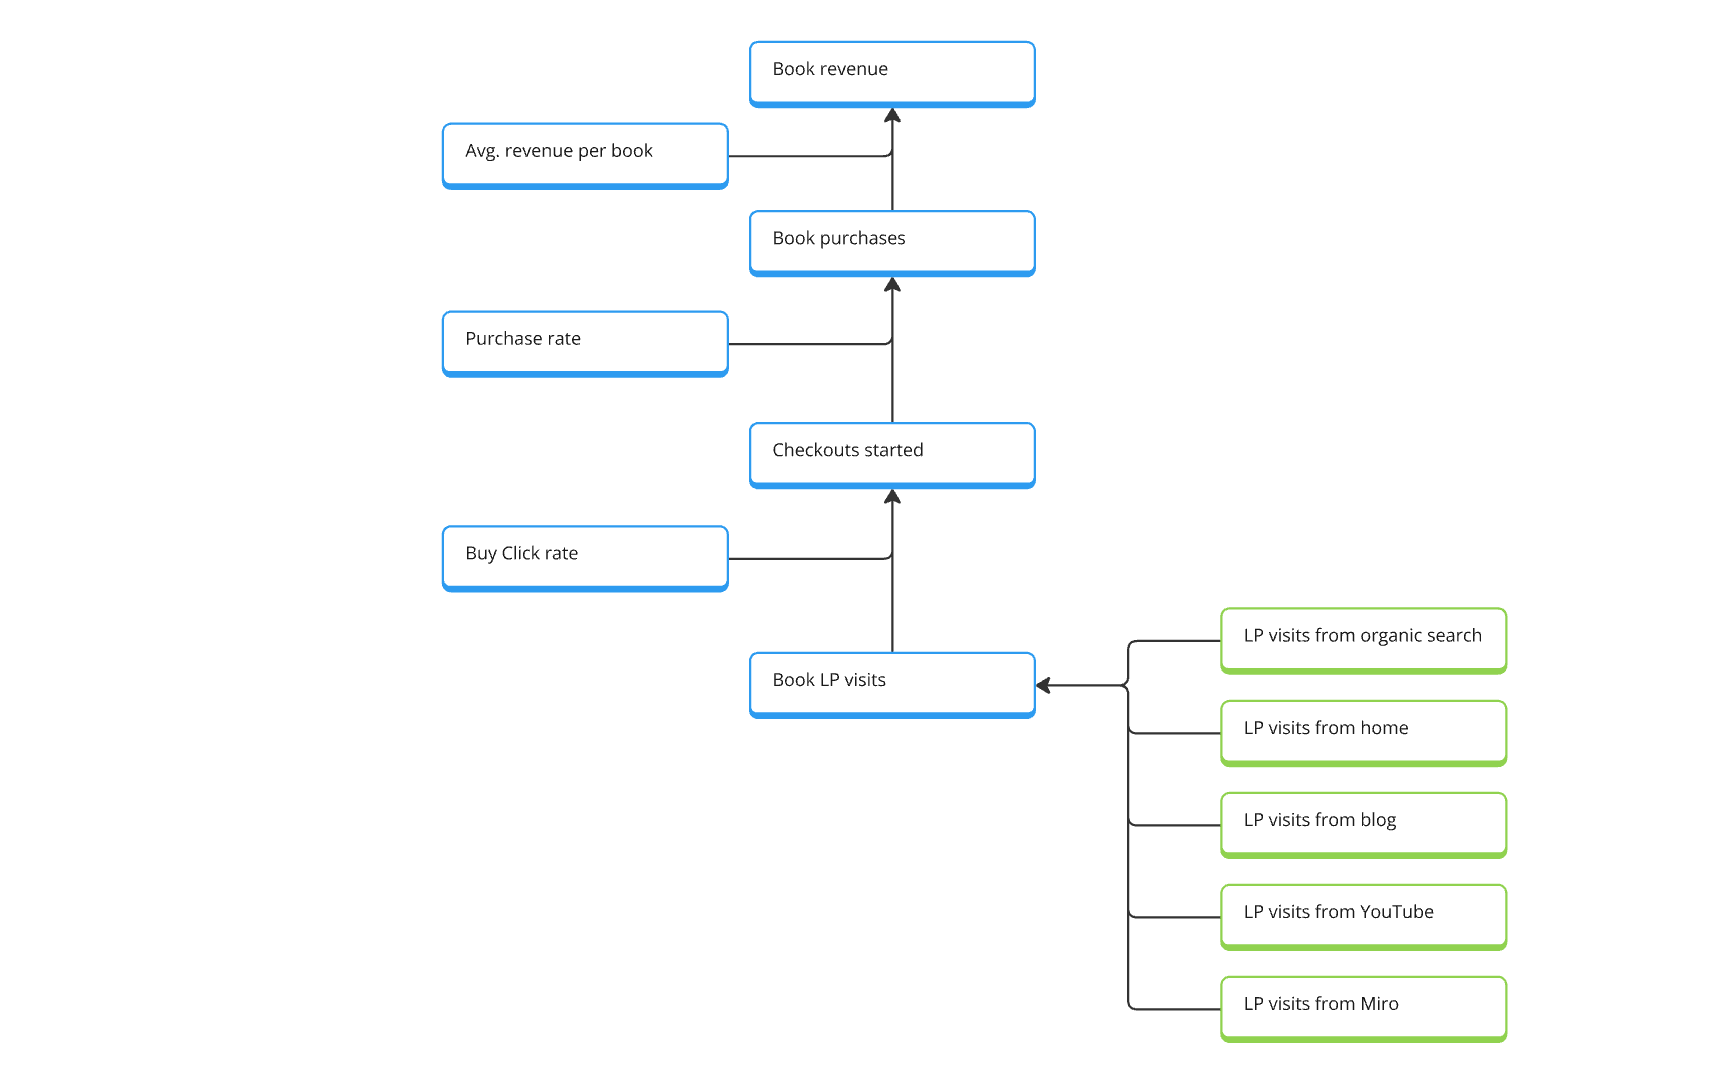
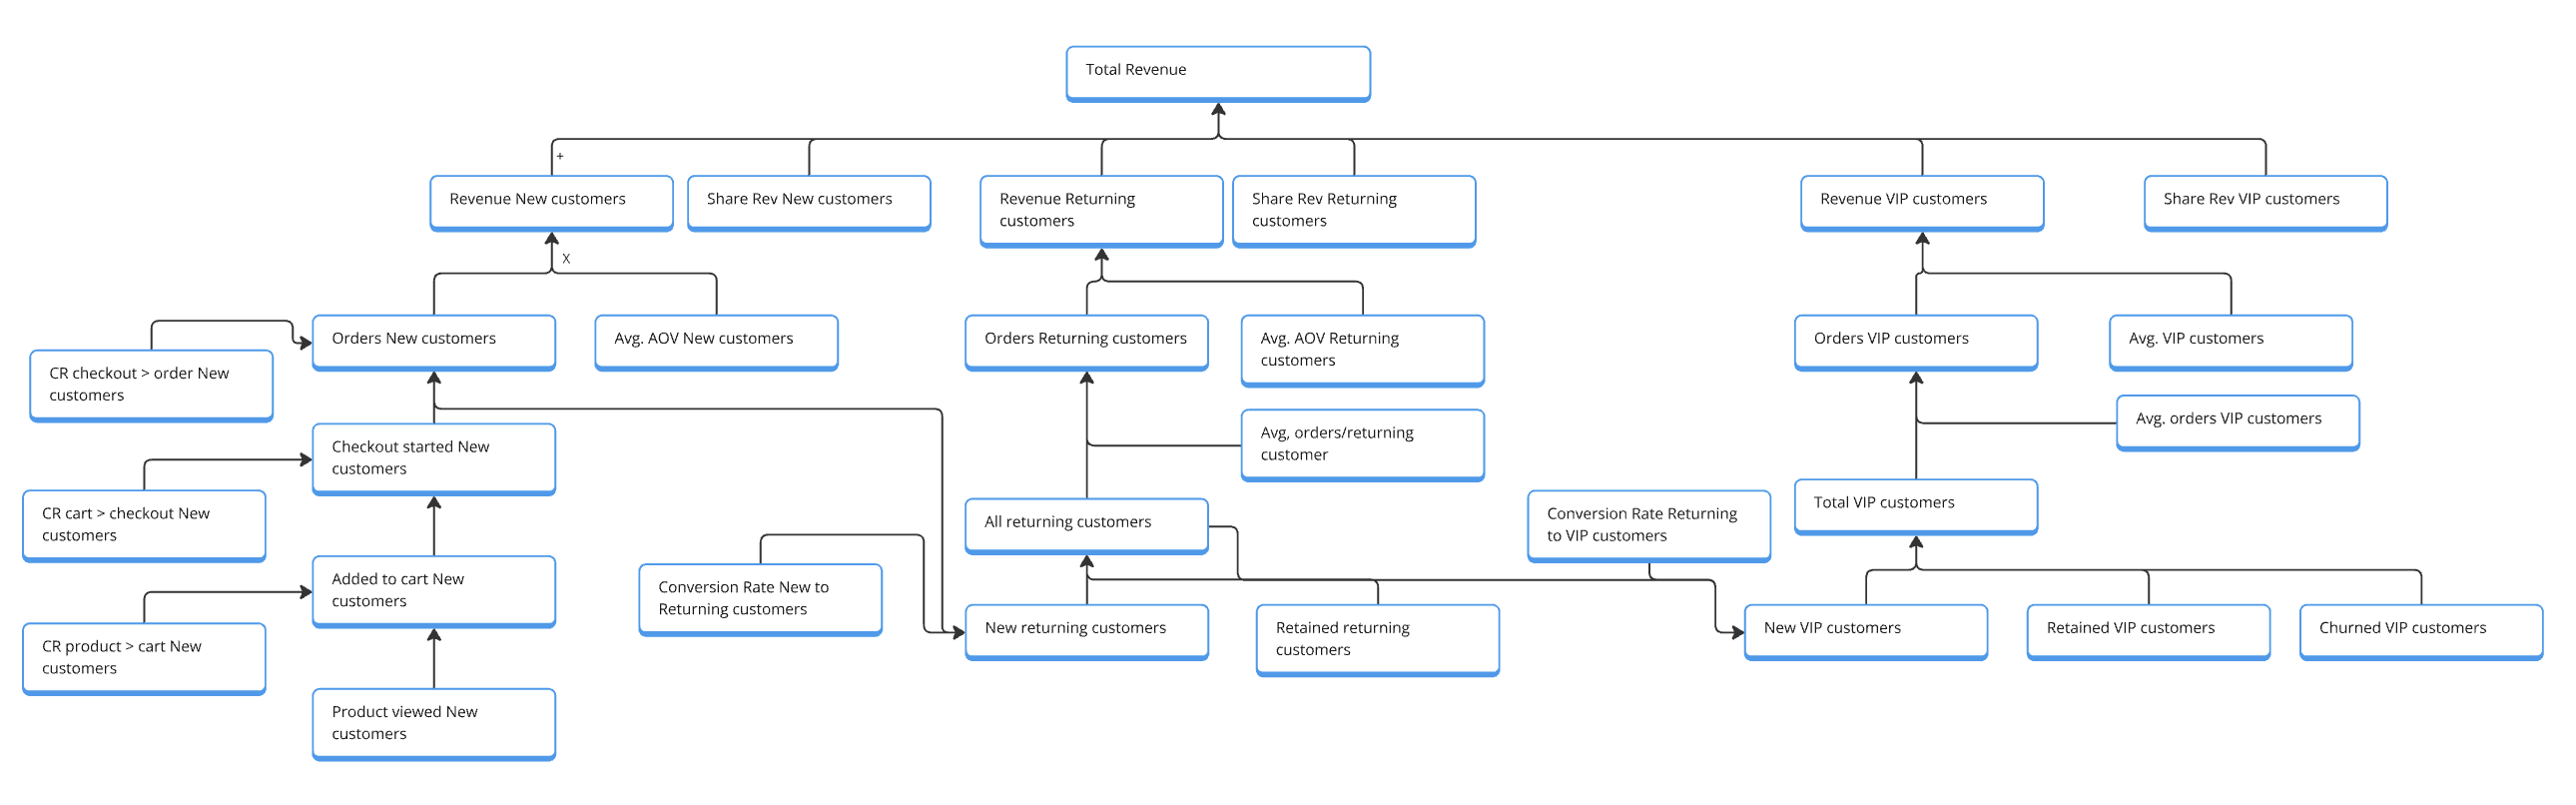
High-level e-commerce tree with focus on customer segments
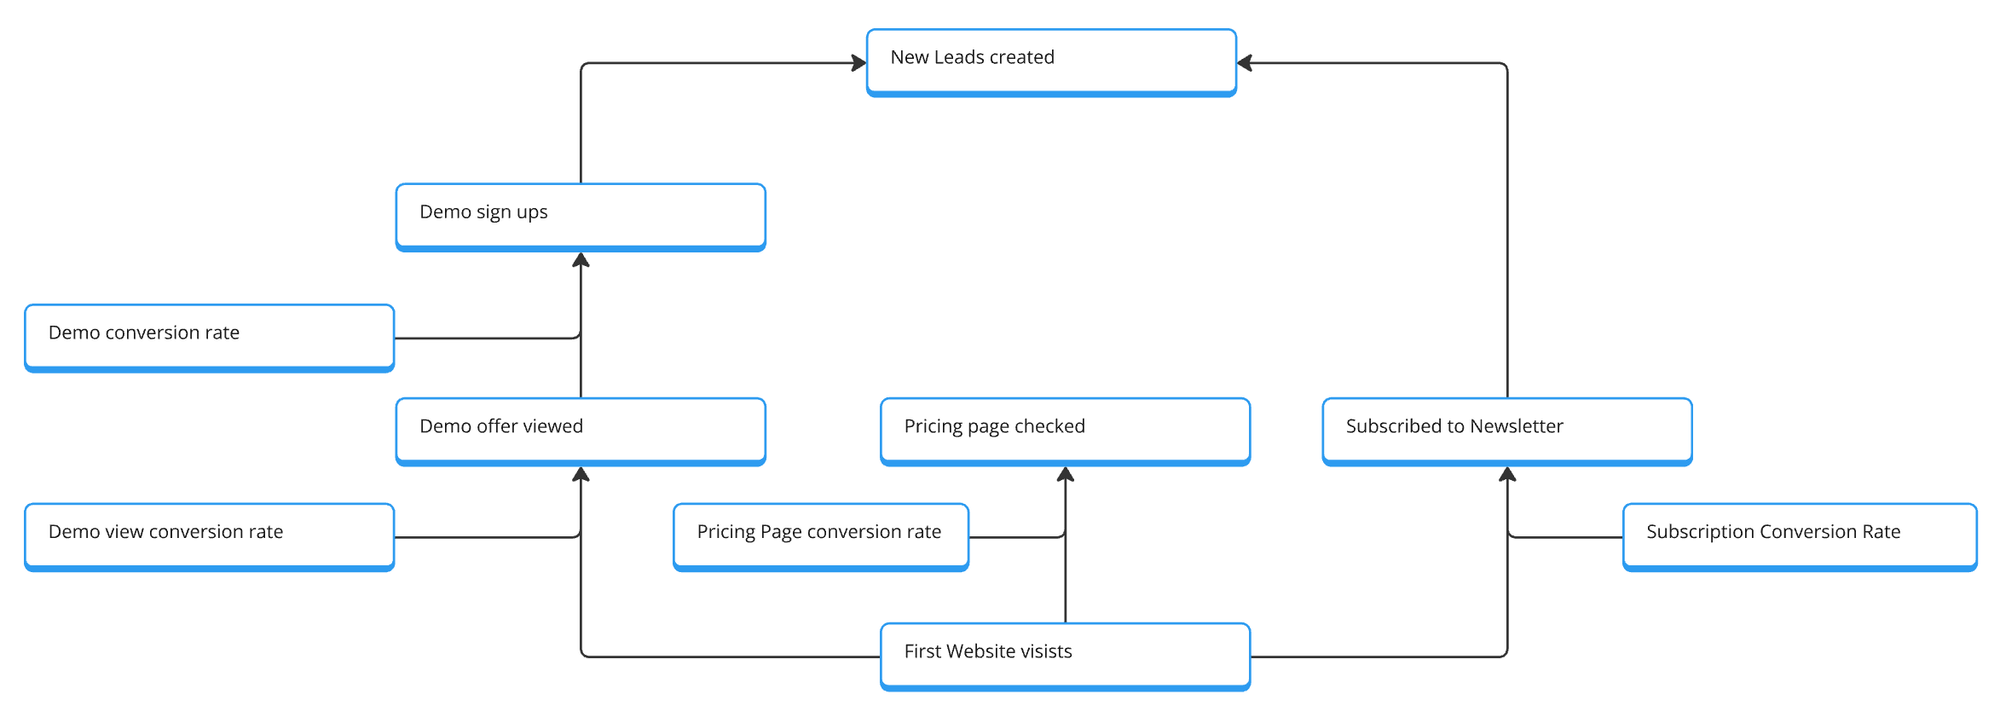
B2B marketing website - very simple to Lead conversion tree:
How to build your own?
Getting started with metric trees is simple - you don't need special approval or tools. All you need is a whiteboard or piece of paper. You can start sketching right away.
Want a more structured approach? Start with what you already know. Take the examples from this blog post and design something similar for your business case. Remember two key principles: make sure it creates an equation (all steps should add up), and resist the temptation to add too many elements.
Once you have a first draft, meet with different teams. Talk to marketing about the acquisition flow - how do we get new accounts? What do we invest in? What matters most to them? Use their input to create the acquisition branch. Repeat this process with other business areas until you have a high-level tree that explains how your online business generates revenue (or leads, or whatever your digital business aims for).
Then you can dive deeper. If the product team wants to understand their place in this picture, work with them to construct their branch. One warning though: creating metric trees for product teams isn't easy. I'll write a future post about this approach because product metrics can be extremely noisy. When working with feature-level metrics, you need to find better abstractions for your tree.
The key to success is talking with others about your metric tree. Since metrics are something everyone understands, it's a great format for discussion.
Remember, you can start with basic tools - paper, whiteboard, or software like Miro or Excalidraw. You don't need specialized software yet. That might come later if you want to visualize numbers, but for design, you already have everything you need.
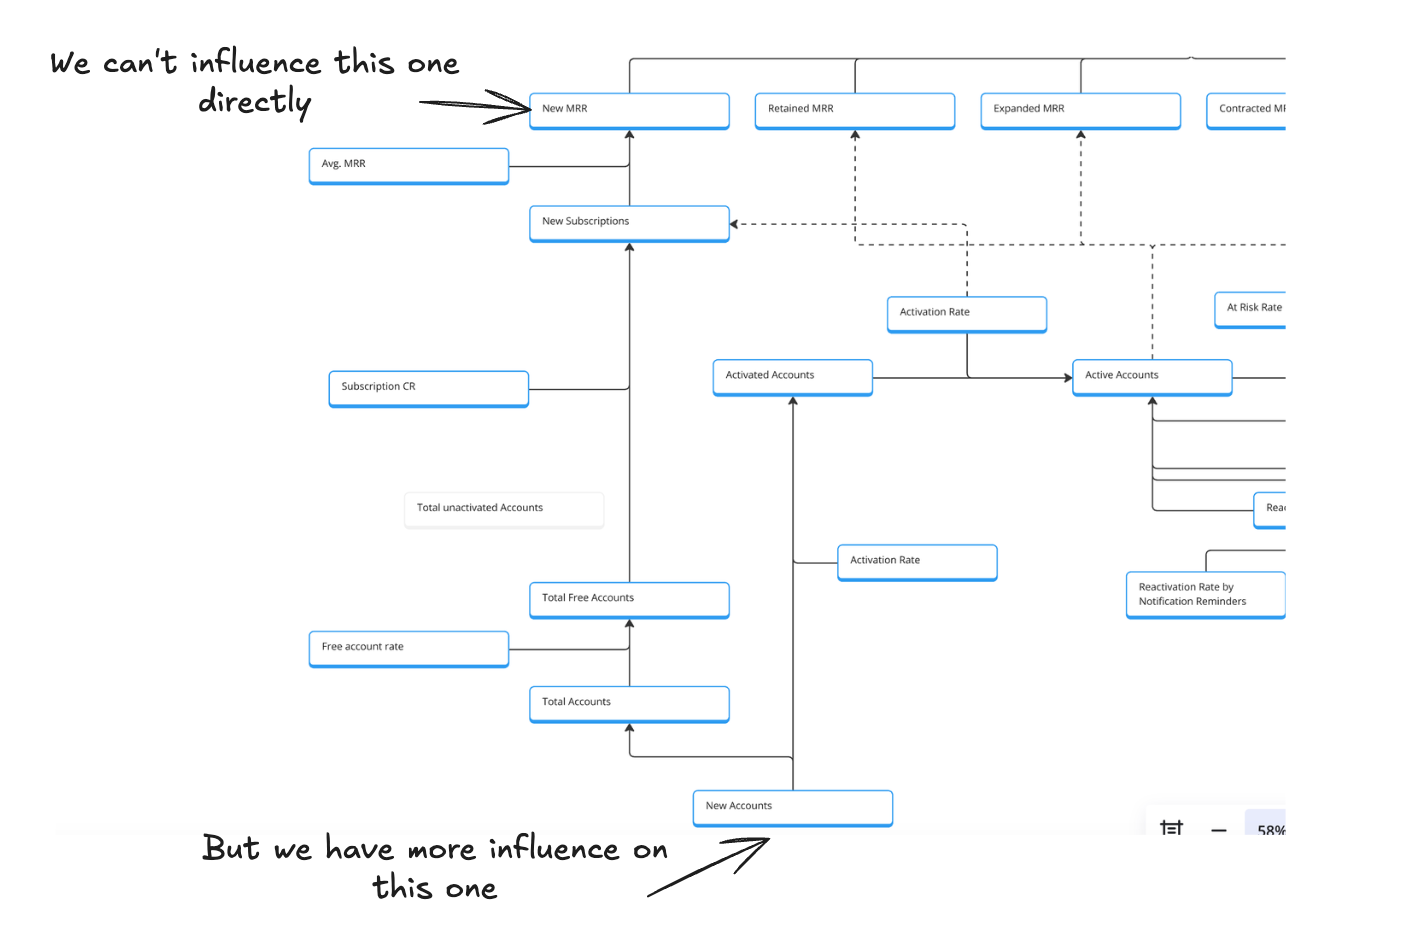
Once you have your first metric tree, you can use it to understand growth levers. Some areas of the tree have more potential for impact than others. Interestingly, the lower you go in the tree, the more operational and directly influenceable the metrics become. Top-level output metrics like revenue can't be influenced directly, but as you break things down, you find more actionable areas.
Take a subscription business, for example. Starting with revenue at the top, you might branch down to new subscriptions, then to the acquisition process. Eventually, you reach metrics marketing can directly influence, like visits from paid ads. These highly influential metrics can be affected quickly by tactical changes.
Look for metrics that can be influenced directly and have meaningful downstream impact. For instance, marketing might be great at generating ad visits, but the demo conversion rate might be low. If you know from your metric tree that people who watch demos have a good chance of becoming subscribers, there's an opportunity. Improving demo conversion for ad traffic could significantly impact the business.
Marketing might have already thought of this, but your metric tree can visualize the potential impact: "If we increase ad traffic conversion by 10%, we could see a 3-4% increase in new subscriptions, significantly impacting revenue."
The metric tree makes it easier to find areas for focus and have data-driven conversations. It's a great first use case - you can have productive conversations with marketing about improvements, provide data support, help implement initiatives, and track impact over time.
I hope this has gotten you excited about metrics again. Even a simple metric tree can transform how you approach analytics projects and communicate with the business about their goals and how analytics can support them.
If you have questions, let me know in the comments, send me an email, or reach out - I'm happy to help!

Join the newsletter
Get bi-weekly insights on analytics, event data, and metric frameworks.