The dark side of growth metrics

This will help you to understand why your CFO doesn’t like your growth rate.
Metrics by themselves aren't easy. They have these different levels that make them surprisingly complicated. On the surface, metrics look straightforward - you've probably seen those LinkedIn posts promising "the ultimate list of 200 SaaS metrics" where you just pick what works for you and build your KPI dashboard.
The tricky part comes when you dig deeper. Actually applying and using metrics creates real frustration because metrics need proper context and clear definitions. That's one challenge that trips up many teams.
But today I want to explore something different - an area often missed in public metric discussions. I call it "the dark side of gross metrics."
Before explaining what I mean by this, I need to walk you through some background so everything fits into place. This hidden aspect of metrics might change how you think about measurement in your marketing and product work.
The shiny side of growth metrics and models
When we look at the available content about growth analytics, we can find some excellent resources. For example, there's Abhi's metric tree that covers the growth side for a subscription-based business in amazing detail. It provides lots of inspiration for how to build a metric tree for subscription businesses.

Then there's the growth model that Duolingo posted, which has become really popular - probably one of the most shared resources I pass along to people.

And I've written about some metric trees myself, like this e-commerce example:

These models are extremely helpful for understanding how to grow your business. But they're missing something important. These metric trees have this relative who never gets invited to parties - because he's very rational, no fun, and can instantly kill the mood. This uninvited relative is the unit economics of everything happening on the growth side.
In my experience, looking at unit economics and the cost side of things is often completely ignored in analytics. We live in this nice fantasy where as long as we create revenue, everything will be fine. But unfortunately, there are plenty of cases where businesses grow revenue significantly, increase their accounts dramatically, and still go out of business because they don't make money in the end.
This is where costs and unit economics come in.
The promise of this post isn't to fully explain unit economics and their impact. I am working on a course for that (you can join the waitlist here: https://lp.timodechau.com/strategic_analytics/
if you want to understand it more deeply).
This post is mainly to make you aware that there's a dark side to every growth metric we happily ignore because it might end the party immediately.
I want to walk through different examples to show what it would look like if we didn't just focus on the positive side of a metric tree, but also designed the "shadow branch" that tells us whether this whole thing actually makes sense financially.
Developing the shadow branch
In our first example we pick an example most of us have come across: E-Commerce Revenue. Let's have a look at our E-commerce Tree snapshot:
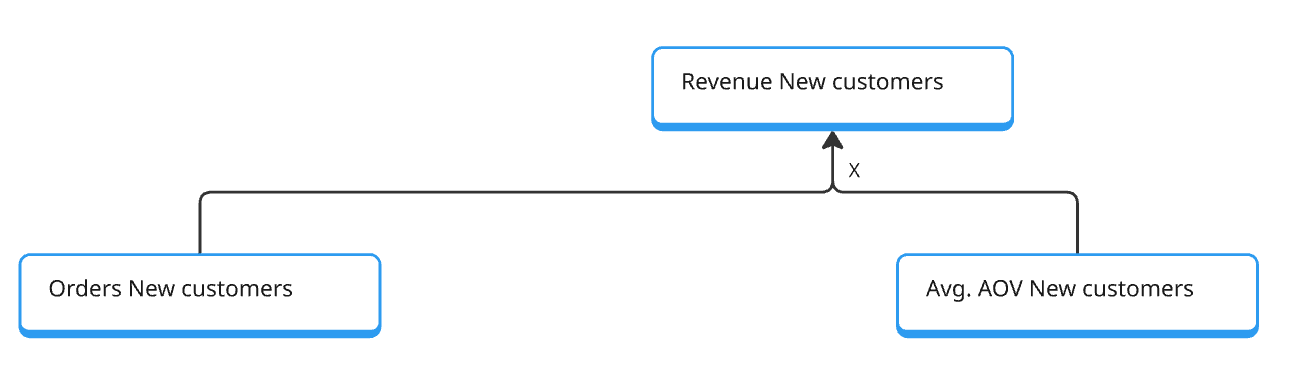
So far, so good. We want to grow revenue by new customers since our business wants to scale dramatically and we can't just do it by increasing returning customer revenue. We get more new customer revenue by either increasing the total orders of new customers or by increasing the avg. order value (in best case we increase both).
Let's say our marketing team did a great job and they could increase the orders by 20% and even increased the AOV by 5%. Huge party during the monday meeting.
But we should look at the shady branches of this part of the tree.
The first extension is a quite well known one - we are adding the Return on Ad Spent (ROAS). The ROAS itself deserve a post by it's own, but this is something for the future (or you read Juliana's post about it: https://julianajackson.substack.com/p/not-all-revenue-is-created-equal).
With the ROAS we at least get a better feedback about if we acquired the users on reasonable economic terms (one problem of ROAS is the time dimension of the initial acquisition and not the long term of the customer value - but we don't want to get started on CLV).
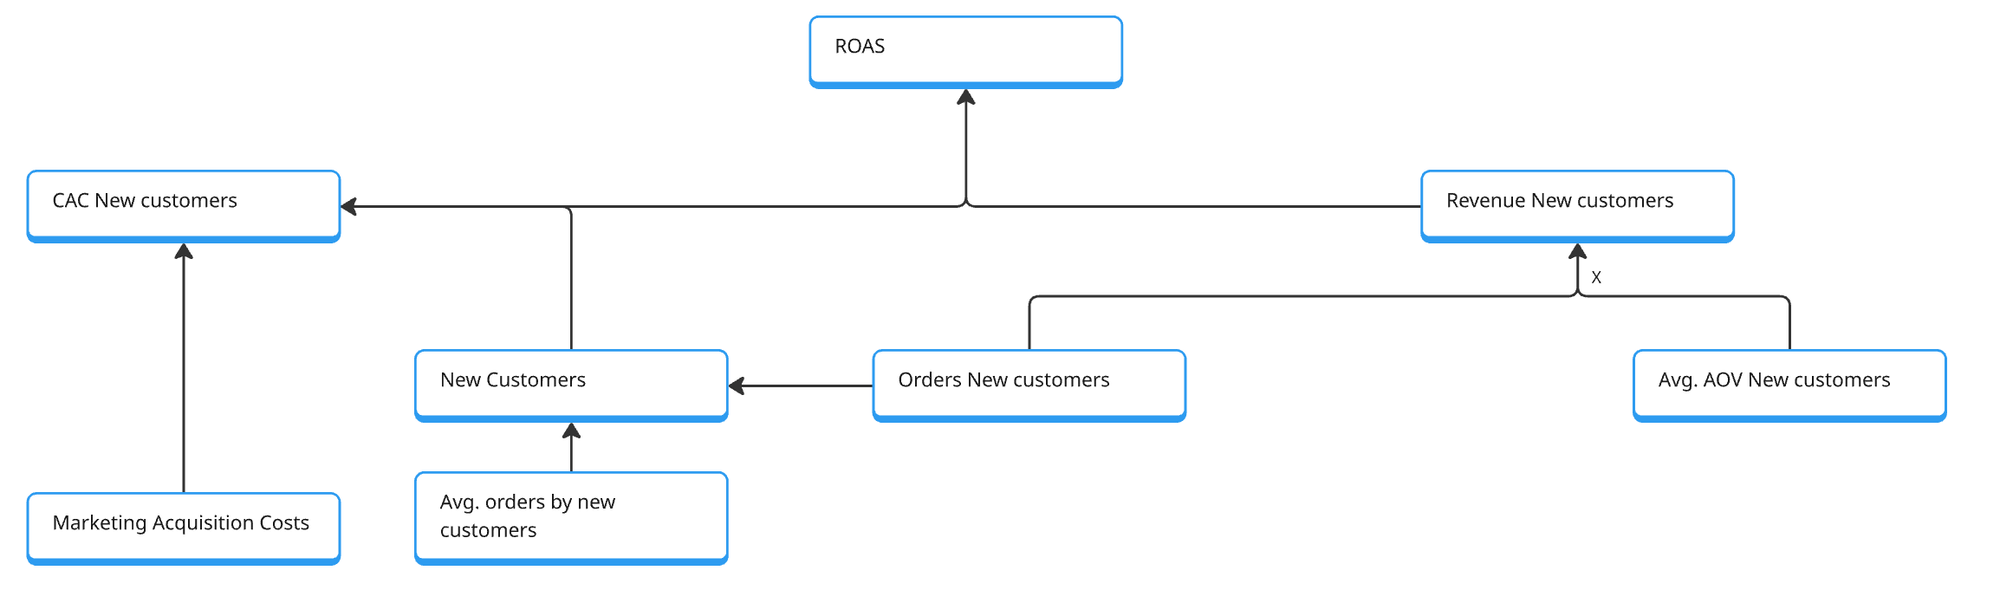
At least here we see if our initial new orders generate can generate profit when we deduct the direct marketing acquisition costs. But this is just part of the picture. Most agencies celebrate good ROAS for their campaigns. It's time to stop the music.
This part is usually the party crasher and is loved to be ignored for a long time:
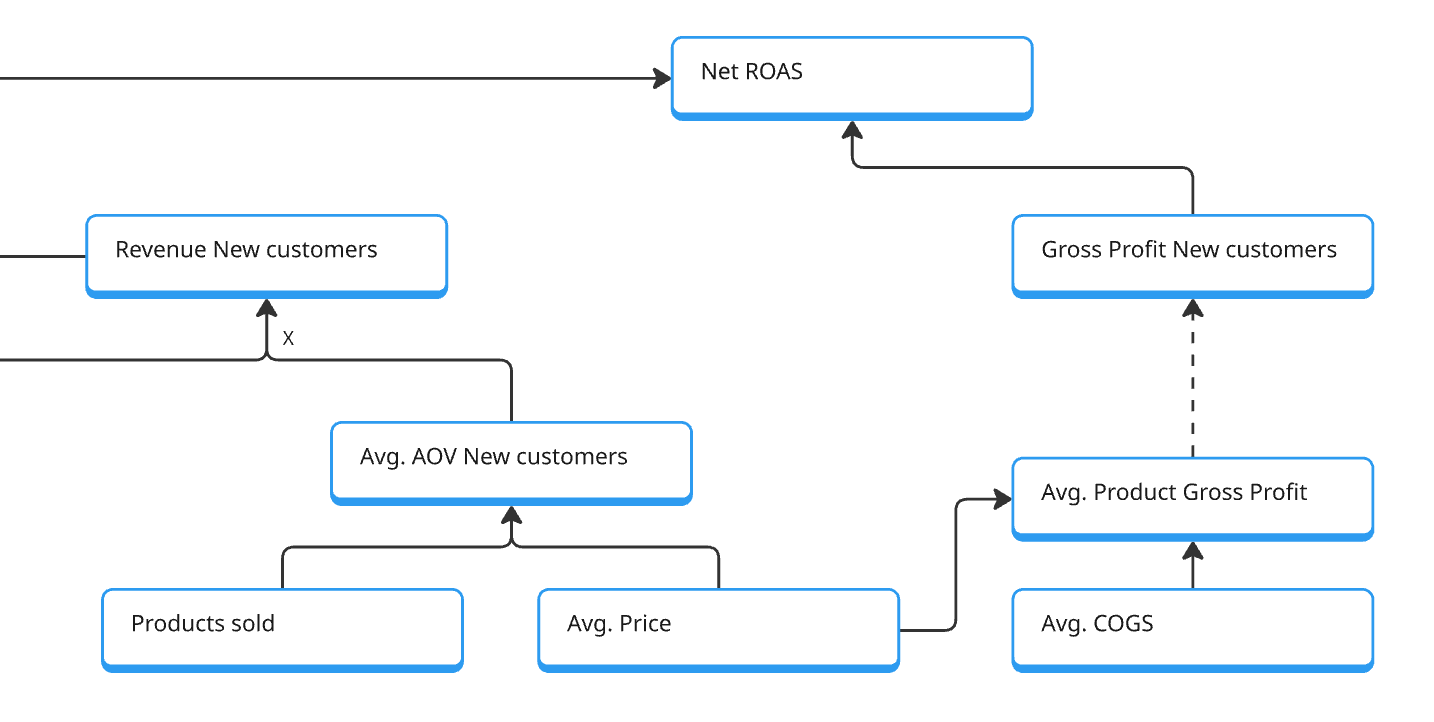
Every product we sell is not pure revenue. We have to acquire or produce and ship the product to our hard-won new customers. So first we can deduct the Costs of Goods sold for each product to get to the Gross Profit (we can also calculate the Gross margin to make it easier to keep in mind what is actually left for profit contribution). But COGS are just the beginning, when we are serious about our business we will calculate the different levels of profit:
|
Subtract from revenue |
Resulting margin |
|---|---|
|
COGS |
Gross margin |
|
COGS + variable ops (pick/pack, payment fees) |
Contribution margin |
|
COGS + variable ops + marketing |
Marketing contribution margin |
|
All operating expenses |
Operating margin |
|
All expenses incl. taxes |
Net margin |
With all this in place we can calculate a net ROAS, which I can tell you from experience, can ruin a bright agency call pretty quickly. Again ROAS is a short term view - projected on CLV will paint a different picture, but is also a more complex topic.
So the shady branch of all growth metric trees are the branches that cover the cost impact and they often represent what I have mentioned before: the unit economics.
So let's do a quick refresher.
What are unit economics
Unit economics zooms in on the profitability of a single item you sell and asks a simple question: does each unit put more money in your pocket than it takes out?
In our product example, the product sells for €40 while its cost of goods sold (COGS)—the materials and manufacturing—runs €25. That €15 difference is your gross profit per unit. Expressed as a percentage, it's a 37.5% gross margin, meaning that for every euro of revenue the widget brings in, roughly 38 cents stay with you after covering production.
Why does that matter? Because gross margin is the first—and usually the largest—layer of cushion that has to absorb everything else: fulfillment fees, marketing spend, overhead, and eventually your desired profit.
A positive, healthy gross margin tells you the product is fundamentally sound; a razor-thin or negative one signals you'll bleed cash no matter how many units you sell. By grounding the rest of your P&L in this single-unit perspective, you can forecast scale-up scenarios, set discount floors, and decide how much customer-acquisition cost (CAC) you can afford without eroding profitability.
How to work with unit economics in your growth analysis
In my work I add the layer of unit economics usually when I have created a growth model. For some models the unit economics are quite straightforward.
Let's say for my book (https://timodechau.com/the-analytics-implementation-workbook/)
I have to pay ~8% for my payment provider and sometimes people use discounts to buy the book. The calculation of my gross profit would look like this:
|
Layer |
Formula (per unit) |
No discount |
20 % discount |
50 % discount |
|---|---|---|---|---|
|
Sticker price |
P₀ |
$40.00 |
$40.00 |
$40.00 |
|
Discount |
P₀ × discount% |
– $0.00 |
– $8.00 |
– $20.00 |
|
Net selling price (cash in) |
P₁ = P₀ × (1–discount%) |
$40.00 |
$32.00 |
$20.00 |
|
Payment-processor fee (8 %) |
P₁ × 0.08 |
– $3.20 |
– $2.56 |
– $1.60 |
|
Gross profit (€/unit) |
P₁ – fee |
$36.80 |
$29.44 |
$18.40 |
In my growth model, for all organic traffic sources I could now use these values as unit costs to calculate my gross profit.
For any paid marketing I would need to extend it with the actual marketing costs for each channel. So I could define $10 contribution margin that I want to make with my book. This would leave me space to afford up to $26.80 Customer acquistion costs (in case there is no discount use - also a good reminder, that discounts can hurt your economics).
So, why is all this so important?
If you would take the 40$ revenue, define a contribution margin of 10$ - I would calculate with 30$ CAC. Let's assume, I would really cap at 30$ CAC, this means with every book sold, I would loose 3.20$. That would be no fun.
But we have raised money and need to grow
Well congrats.
Even in a classic startup growth scenario, where you have raised money to fuel your growth, the unit economics are essential to know. Because it gives you control over how much money you are bleeding with every new customer. It gives you control about the growth curve.
Let's highlight this with another example:
Meet “AICanvas” (Gen-AI Image & Design Platform)
Core offer: “Unlimited images” plan at $20 / mo for creators.
Average usage: 80 % of users create 100 images/mo; 20 % create 2 000 images/mo.
Variable COGS: GPU inference $0.03/image (compute + storage). Hidden cost: model-fine-tuning amortization ≈ $5 / user / mo. (the investment)
Customer acquisition: Social + creator bounties: $8 CAC.
Retention / churn: 6-month average life for light users, 18 months for heavy users ⇒ blended annual churn ≈ 80 %. (it's AI crazyness - we need to keep this in mind)
Unit-economics reality:
- Light users: revenue $20, cost $3 + $5 = $8 ⇒ 60 % margin. (PARTY)
- Heavy users: revenue $20, cost $60 + $5 = $65 ⇒ –225 % margin. (WELL)
Weighted gross margin: (0.8×$12 + 0.2×–$45) / $20 ≈ –15 %.
Every new subscriber increases cash burn. CAC doesn’t matter when gross margin is negative.
Red analytics flags:
- Usage distribution is a power law: 20 % “power users” drive 80 % of GPU cost.
- Model-tuning spend scales with user count, not usage, so even light users are under-priced.
- Cash burn per incremental user increasing despite headline “hyper-growth.”
The Cash burn can be ok, because it is priced in the last investment round - but being aware of the power user problem, should be addressed in future product or pricing strategy.
1- Usage-based margin histogram: reveals heavy-user losses instantly.
2- Scenario model: raise price, cap images, or introduce token-based overage fees and re-run margin curve.
3 - Churn-segmented LTV: shows that even light users are unprofitable after model-tuning cost, prompting a free-tier/trial + pay-as-you-go design instead of “unlimited.”
Do we need to build more complex growth models and metric trees now?
No. But you should add line items in your growth models for each marketing channels to calculate the marketing contribution margin to evaluate marketing initiatives based on that instead of the revenue.
And have your unit economics up to date. This is especially true for SaaS models, where it feels like zero-marginal costs, but that's not true.
And for the metric trees - the more I work with them, I see them as snapshot visualization. So I use them as I did here, to showcase a scenario, like how can we calculate a Net ROAS instead of the usual ROAS.
Again - if you like to learn more about unit economics, join the waitlist for our course, where we will spent plenty of time on this topic:
Join the newsletter
Get bi-weekly insights on analytics, event data, and metric frameworks.